When you scrape data from the web, you are supposed to provide it to stakeholders with a logic and/or a structure. However, especially when scraping from different sources, you need to give a structure to the scraped data. In other words, unless you are scraping tabular data from a single table, the structure of the data does not come for free: you have to work on that.
The process of creating a structure from scraped data (or giving it logic) is time-consuming. Imagine you have scraped thousands of images from different websites. A stakeholder may ask you:” Can you subdivide the images into folders, regrouping for topics?”. Well, it would be helpful, wouldn’t it? But how would you do that?
The good news is that there is no need to throw the computer at the stakeholder who asked you this question. AI can help you find patterns in data and, therefore, guide you in giving a structure to it.
Follow me along this article to learn the common techniques you can use and how to apply them in Python.
Before proceeding, let me thank Decodo, the platinum partner of the month, and their Scraping API.
Decodo just launched a new promotion for the Advanced Scraping API, you can now use code SCRAPE30to get 30% off your first purchase.
Before going into the details of pattern extraction using AI, let’s discuss what “using AI” means today.
Artificial Intelligence is a vast field. The schema in the image below shows you how the underlying technologies are subdivided:
The subfields of AI
So, when referring to Artificial Intelligence, it means you are using one or more of the following:
Machine learning models.
Deep learning models.
Generative AI models (aka, LLMs).
Today, maybe because of the rise of LLMs and agents, we tend to think that “using AI” means something like “I’m creating a system that autonomously does something using agents and/or LLMs”. The reality is that “using AI” means using one of the technologies described above, without any need for the system to be completely autonomous.
For example, you could train machine learning models to detect bot triggers and still say to your colleagues: “Hey guys, I’m creating an AI system that detects bot triggers. This will be a game changer for our scraping projects!”.
Considering this, at a high level, you could say that there are two macro-categories to detect patterns in data:
The classical method: This uses machine learning and deep learning models with unsupervised learning.
The modern method: This uses LLMs.
The following sections discuss both methodologies.
This episode is brought to you by our Gold Partners. Be sure to have a look at the Club Deals page to discover their generous offers available for the TWSC readers.
Detecting Patterns in Scraped Data With Unsupervised Learning
The classical method of detecting patterns in data is by using unsupervised machine learning or deep learning models. The reason why you do this is that these models can find patterns in multi-dimensional data, which is impossible to do “by hand”.
At a high level, the process is simple:
You scrape some data.
You aggregate the data, if needed.
You feed an unsupervised model with the aggregated data, and verify if patterns exist.
As you can imagine, not everything that shines is gold. The high-level process is fairly simple, but there are a lot of nuances under the hood that you have to master. The first thing to consider is to subdivide the cases based on the data. The subdivision is the following:
Structured data: Refers to data that has a standardized format for efficient access by software and humans. It is typically tabular with rows and columns that clearly define data attributes. In the case of web scraping, tabular data is typically stored in tables.
Unstructured data: Refers to anything else that does not have a defined structure. It can be text and numbers scattered on a website. But it can also refer to audio, video, or image data.
As you can understand, the methodologies to find patterns in scraped data are fairly different if your data is structured or unstructured. In particular, unsupervised learning for unstructured data is a vast field. In the next subsections, I will guide you through the main ideas for both cases, so that you can apply them to your specific case.
Before continuing with the article, I wanted to let you know that I've started my community in Circle. It’s a place where we can share our experiences and knowledge, and it’s included in your subscription. Enter the TWSC community at this link.
Let’s discuss common unsupervised learning techniques to find patterns in structured data.
Clustering numerical data
Clustering is probably the most commonly used and known unsupervised method. Let’s consider a practical scenario where you have scraped data in the real estate industry. Your dataset could be something like the following:
A table of data from the real estate industry
If you do not have any reference on where this data came from, you could ask yourself: “Is there a way I could group this data for latitude and longitude?”. This is a common question whose answer lies in unsupervised learning. Finding the answer by hand, in fact, would be very difficult if not impossible.
Imagine you have scraped this real estate data and saved it into a real_estate_data.csv file. To answer your question, you could use the k-means clustering algorithm as follows:
# In an activated virtual environment: pip install pandas matplotlib scikit-learn

import pandas as pd
from sklearn.cluster import KMeans
import matplotlib.pyplot as plt

# Load the dataset
data = pd.read_csv("real_estate_data.csv")

# Use all features for clustering
features = ["price", "area", "bedrooms", "latitude", "longitude"]
X = data[features]

# Apply KMeans clustering
kmeans = KMeans(n_clusters=3, random_state=42, n_init=10)
clusters = kmeans.fit_predict(X)

# Add the cluster labels to original dataframe
data[”cluster”] = clusters

# Plot the results
plt.figure(figsize=(10, 8))
scatter = plt.scatter(data["longitude"], data["latitude"], c=data["cluster"], cmap="viridis")
plt.title("Real Estate Clusters by Location")
plt.xlabel("Longitude")
plt.ylabel("Latitude")
plt.legend(handles=scatter.legend_elements()[0], labels="City Center", "Suburbs", "Rural"])
plt.grid(True)
plt.show()
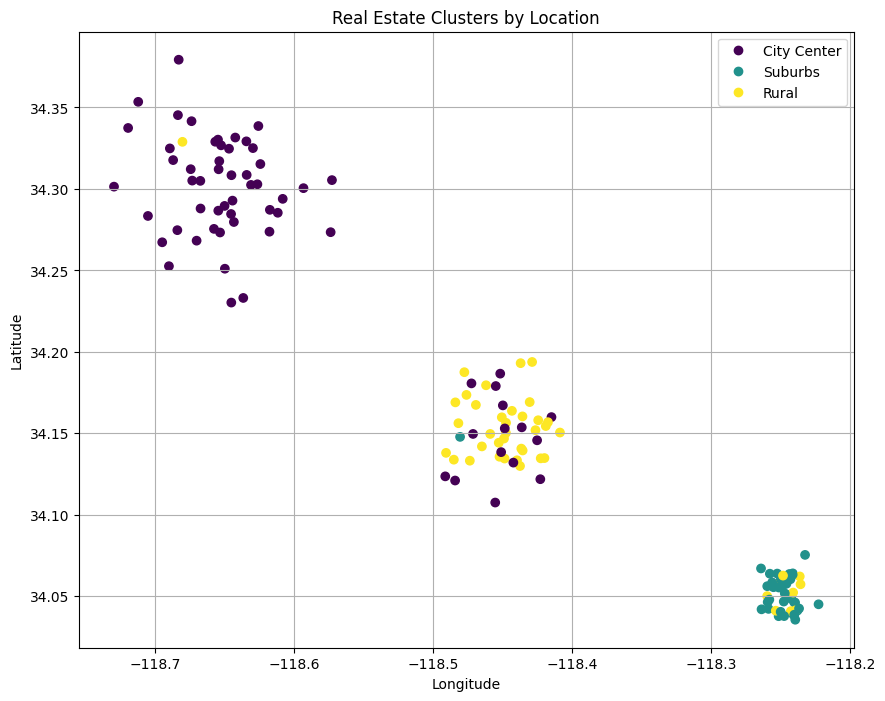
The resulting plot is the following:
Three clusters from real estate data
So, the k-means algorithm has found a pattern in the scraped data and regrouped it into three clusters. However, the reason why not everything that shines is gold is that you have to define the number of clusters. In this case, you defined n_clusters=3.
If you change the value of this parameter, you will find different results. So the point of the task, in this case, is to iterate with different values of the n_clusters parameter to find the optimal one. And, of course, there are cases where data can not be clustered, meaning that there is no specific pattern inside the data you scraped.
Clustering is also suitable for textual data. The only thing necessary in this case is data transformation. The point is that the k-means clustering algorithm can be directly applied to numerical data, as done in the previous paragraph. With textual data, instead, you first need to create a numerical representation of each word using a word embedding model. Then, you can apply the K-Means clustering to the embeddings to group similar words.
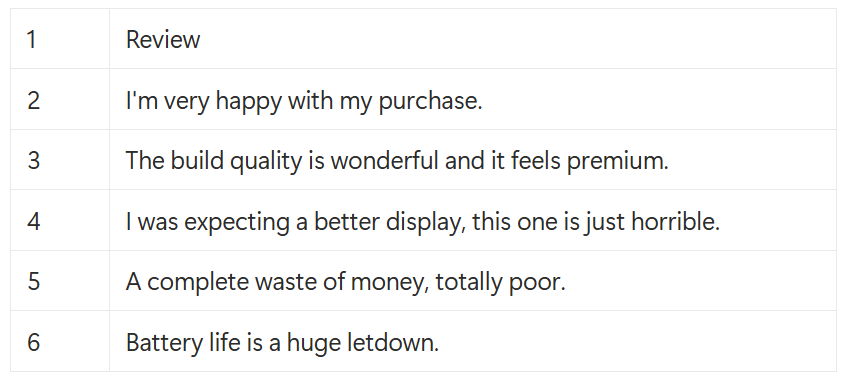
Imagine you have scraped some textual review from a product in an e-commerce, maybe because you want to perform a sentiment analysis on the data. You could have saved the data in a customer_reviews.csv, which can be something like the following:
Product reviews scraped from an e-commerce site
To create embeddings—aka, numerical representations of the words to, then, apply the k-means clustering—you can use, among others, the sentence-transformer model. Below is a script you can apply to this clustering case:
# In activated virtual env: pip install sentence-transformers scikit-learn matplotlib pandas

import pandas as pd
from sentence_transformers import SentenceTransformer
from sklearn.cluster import KMeans
from sklearn.manifold import TSNE
import matplotlib.pyplot as plt
import numpy as np

# Load the dataset
review_df = pd.read_csv("customer_reviews.csv")

# Load pre-trained sentence transformer model
model = SentenceTransformer("all-MiniLM-L6-v2")

# Generate embeddings for each review
review_embeddings = model.encode(review_df["review"].tolist())

# Apply KMeans clustering to group the review embeddings
num_clusters = 2
kmeans = KMeans(n_clusters=num_clusters, random_state=42, n_init=10)
clusters = kmeans.fit_predict(review_embeddings)

# Add cluster labels to the DataFrame
review_df["cluster"] = clusters

# Use t-SNE to reduce the 384-dimensional embeddings to 2 dimensions for plotting
tsne = TSNE(n_components=2, random_state=42, perplexity=5)
reduced_embeddings = tsne.fit_transform(review_embeddings)

# Plot the results
plt.figure(figsize=(12, 10))
scatter = plt.scatter(reduced_embeddings[:, 0], reduced_embeddings[:, 1], c=review_df["cluster"], cmap="viridis")
plt.title("Customer Review Clusters (Visualized with t-SNE)")
plt.xlabel("t-SNE Feature 1")
plt.ylabel("t-SNE Feature 2")
plt.legend(handles=scatter.legend_elements()[0], labels=[f"Cluster {i}" for i in range(num_clusters)])

# Annotate points with an index to cross-reference with the text
for i, txt in enumerate(review_df["review"]):
    plt.annotate(f'  {i}', (reduced_embeddings[i, 0], reduced_embeddings[i, 1]))

plt.grid(True)
plt.show()
After applying the k-means clustering to the embedded dataset, the above code uses the t-SNE model to decrease the number of dimensions to 2. This way, the data can be plotted in a 2-dimensional graph, which is the following:
Clusters from scraped product reviews
The numbers associated with each data point correspond to the row in the dataset. In practice, what this code does is group the data into two clusters, reporting the reference row. This way, you can go to the dataset and see that, somehow, the datapoints with the same colour have something in common. In this case, the clusters are only 2. This basically means that the data are clustered for “positive” and “negative” reviews.
So, in such cases, the iterations you could do to find the optimal patterns are:
Increase the number of clusters.
Change the word embedding model.
By cross-referencing results with these two iterations, you could find interesting patterns. For example, say you have scraped reviews of a mobile phone from an e-commerce site. After iterating and testing, you could find reviews grouped for:
The camera that does not work.
Bad shipment.
A fantastic display.
Very durable battery.
And so on.
The Web Scraping Club is a reader-supported publication. To receive new posts and support my work, consider becoming a free or paid subscriber.
Finding Patterns in Scraped Data: Unstructured Data
Now, let’s consider one case of unstructured data. This represents everything else that does not have a precise structure, including: social media posts, text from news articles, images, videos, audio, forum discussions, and more.
Imagine you have scraped the headlines from thousands of news articles from various sources over the past week. The data you have stored in a news_headlines.csv file is a list of headlines: an example of unstructured and unlabeled data. You want to understand the major news themes during this period. For example, are people talking about technology, finance, or sports? This procedure is called “topic modeling”. You basically scrape news headlines (or also complete articles), and use unsupervised learning to define if the news you scraped belongs to specific topics.
For example, the CSV file can be something like the following:
Headlines scraped from several websites
To find patterns in such unstructured data, you can use the following code:
# In activated virtual env: pip install pandas scikit-learn

import pandas as pd
from sklearn.feature_extraction.text import CountVectorizer
from sklearn.decomposition import LatentDirichletAllocation

# Load the dataset
df = pd.read_csv("news_headlines.csv")

# Create a document-term matrix with the CountVectorizer model
vectorizer = CountVectorizer(stop_words="english", max_df=0.95, min_df=2)
term_matrix = vectorizer.fit_transform(df["headline"])

# Build and train the LDA model
lda = LatentDirichletAllocation(n_components=3, random_state=42)
lda.fit(term_matrix)

# Print the top words for each topic
def print_top_words(model, feature_names, n_top_words):
    for topic_idx, topic in enumerate(model.components_):
        message = f"Topic #{topic_idx}: "
        message += " ".join([feature_names[i]
                             for i in topic.argsort()[:-n_top_words - 1:-1]])
        print(message)

# Get the feature names
feature_names = vectorizer.get_feature_names_out()

# Print the top 10 words for each discovered topic
print("Top words for each discovered topic:")
print_top_words(lda, feature_names, 10)
Below is what this code does:
It opens the CSV file containing the scraped headlines.
Converts the text in the headline column to a matrix of token counts using the count vectorizer model.
Applies the Latent Dirichlet Allocation (LDA) model to the vectorized dataset. The core idea behind LDA is that each document is a mix of topics, and each topic is a mix of words. The algorithm examines the co-occurrence of words across all documents to mathematically uncover what these topics are.
After running the code, you will obtain something similar to the following result:
Top words for each discovered topic:
Topic #0: game new scheduled launch month event latest hype worth developers
Topic #1: data team user massive exposes ai moves expected major injury
Topic #2: future hints policy changes title vie teams heating inflation sees
So, the LDA model has returned a list of the most important words for each of the three topics it discovered. By looking at these words, you can infer the theme of each topic.
Topic #0: game new scheduled month launch event worth hype latest developers:
This topic is about technology and product launches. The keywords launch, event, new, latest, and developers are associated with the tech industry’s cycle of releasing new products and software. Words like game and hype also fit within this context. The model has grouped all the headlines related to new gadgets, apps, and tech events.
Topic #1: data team user massive exposes AI expected moves major season:
This topic appears to be a mix, but it leans towards sports and tech news. The words team, moves, and major season are classic sports terminology. However, words like data, user, exposes, and AI point to technology news, specifically around data breaches and artificial intelligence. This demonstrates a nuance of topic modeling: sometimes topics can be blended if the vocabulary overlaps or if the dataset has multiple sub-themes. This is a case that should be investigated further to see if these themes separate more clearly.
Topic #2: future hints policy changes teams heating title vie inflation trading:
This topic is predominantly about finance and economics. The keywords inflation, policy changes, trading, and hints are indicators of financial news. The words heating, title, and vie are more ambiguous but can be seen in financial contexts as well (for example, “the economy is heating up,” “vying for market title”).
Again, as you can see from the results, sometimes a single iteration is not sufficient, as Topic #1 can be misleading or not clear enough. In such cases, you need to refine your analysis by changing the parameters of the LDA model (you set n_components=3 in the above code) or by using another model.
Detecting Patterns in Scraped Data With LLMs
In the previous sections, you used machine learning and deep learning models to find patterns in data using unsupervised learning methodologies. Now, in the era where LLMs seem to be predominant, the question that may arise is:” Can I use LLMs to find patterns in scraped data?”. The temptation is powerful: you want to feed an LLM with a bunch of messy data, insert a textual prompt, and get results while sipping a coffee.
The answer to your question is yes. But, again, not everything that shines is gold. And let’s be honest: you can not do that while sipping a coffee! 😉
First of all, in a certain way, you can say that LLMs are unsupervised pattern-finding machines. This is because their pre-training process is a wide self-supervised task where the model learns the statistical patterns, grammar, syntax, semantic relationships, and common-sense knowledge embedded in a vast corpus of text and code.
Also, today, LLMs leverage different modalities (text, images, audio). So, you can use LLMs, feed them with PDFs, images, audio, video, etc, and use prompt engineering techniques to find patterns in data.
Interesting cases you could use LLMs for are the following:
Thematic grouping and clustering: Feed an LLM with a list of documents reporting, for example, product reviews scraped from an e-commerce site. You could use a prompt like the following: Attached are 100 customer reviews. Group them into the primary themes or categories of feedback and provide a descriptive name for each category
Anomaly detection: An LLM has a deep understanding of what “normal” text looks like in a given context. Imagine you retrieved thousands of logs from different servers. You can use the following prompt to find anomalies in your logs: Analyze these server logs for the past hour. Identify any entries that seem unusual, anomalous, or indicative of a potential error, and explain why they are suspicious
Tabular data: You can find patterns in structured data by “serializing” it into a text format. Essentially, you can turn each row of your table into a sentence. Imagine you have a CSV with columns like Age, City, Product_Purchased, Rating , created after scraping an e-commerce site. You can use a prompt like the following: “Based on the customer data provided, what are the common characteristics or patterns of customers who give a rating of 1?”
Image data: It is very difficult to find patterns in scraped images, as you generally scrape dozens or thousands of images per scraping round. Instead of using deep learning models that are hard to train and to use, you can feed an LLM that supports images and ask something like: Analyze these product images. What are the common visual styles or design patterns you observe? Group them based on these visual characteristics.
So, basically, the great advantages of using LLMs to find patterns in scraped data are:
It does not matter if you have structured or unstructured data. You only need to use LLMs that support different modalities (for example, to find patterns in images, you have to use an LLM that supports image recognition).
Everything is managed via prompts, without the need to train specific models for specific cases.
These are significant advantages, but LLMs also have disadvantages and limitations.
Limitations of Using LLMs to Detect Pattern in Scraped Data
LLMs are powerful, but they are not magic bullets. Using them means battling the following trade-off:
Cost: Making API calls to LLMs for a very wide range of scraped data can get very expensive.
Speed (latency): An LLM API call is much slower than a locally run, fine-tuned ML model. It is not suitable for real-time, high-volume processing. Anyway, you need a lot of hardware if you want to run LLMs locally.
Accuracy and hallucinations: LLMs can be wrong or “hallucinate” information. The results, especially for data extraction, must be validated.
Data privacy: You are sending your scraped data to a third party, which might be unacceptable for sensitive information. This is where self-hosted open-source LLMs become important.
So, before using LLMs to find patterns in your scraped data, ask yourself:
What budget do I have?
How do I mitigate hallucinations?
Is latency important?
Is data privacy important?
After responding to these questions, you will be able to define whether you have better use classical methods (ML or DL models) or LLMs.
What Patterns Could AI Help Professional Scrapers Extract?
After discussing the methods, another question may arise: ”Are there common patterns that AI can help me find after scraping the data I need?”.
From my professional point of view, the goal is to have an idea of what you are looking for before you start the process. This helps you decide what methodologies to run for finding the patterns in your scraped data.
Below is a list of key patterns AI can help you with.
Emerging Trends and Sentiment Shifts
You can use AI to detect changes in public opinion or interest in real-time by processing huge amounts of text from news, blogs, and social media to spot shifts in tone that a person would miss.
For example, consider working on a hedge fund where you scrape financial news and social media for mentions of your company. An AI model can detect growing negative sentiment from influential journalists before it hits the stock price, giving you an early warning to sell.
Predictive Pricing and Demand Forecasting
By combining historical data with competitor information, AI can predict future price movements or product demand.
Imagine working for an airline company. The company asks you to scrape competitor prices, hotel availability, and social media mentions of events. After scraping this data, you can use an AI model to predict a jump in demand for a specific route weeks before a music festival is officially announced, helping your airline company to adjust its prices.
Anomaly and Fraud Detection
AI is good at finding data points that do not fit an expected pattern, which often signals fraud, errors, or unusual opportunities.
For this specific case, imagine an e-commerce site that scrapes its own product reviews. An AI model can spot fake review patterns, like a sudden flood of 5-star reviews for a new product from accounts with no purchase history, all using similar phrasing.
Customer Segmentation
Instead of using pre-defined categories, AI can group customers into segments based on their actual behavior, language, or interests discovered from the data using clustering techniques.
As an example, consider a marketing agency that wants to scrape a hobby forum. By analyzing thousands of posts, an AI model can cluster users into groups like “Beginners” (asking about basic tools), “Professionals” (discussing business), and “Artisans” (sharing complex projects).
Visual Pattern Recognition
AI can use computer vision to find patterns in thousands or millions of scraped images: a task impossible to do by hand.
For instance, consider a retail brand that wants to scrape Instagram for images tagged with #fashion. An AI model can analyze them to spot a new trend, like a specific color or accessory appearing more frequently in posts from influencers, before it becomes mainstream.
Conclusion
In this article, you have learned what “using AI” means today and how you can use it to find patterns in scraped data. From a scraping point of view, these techniques are very interesting and useful, as they can help you group your data before providing it to your stakeholders, or for the sake of satisfying your own curiosity about the data you scraped.
So, let’s talk in the comments: are you using some of those techniques? Do you find them interesting?


Fascinating. Unsupervised learning is truly an elegant solution.